At the beginning of March, the Federal Reserve (FED) released its semi-annual monetary policy report. Gold prices reached their highest level in 2024 as market expectations for a June rate cut rose. Just one day later, BTC also hit a new high in market value. The passage of the Bitcoin spot ETF can be regarded as a watershed. After two months, financial promoters are accelerating the maturity of the encryption market and making the market more complex.
However, as an "honest" indicator that reflects the true situation of the market, on-chain data shows that investors are becoming increasingly polarized. As Ouke Cloud Chain Research Institute stated in the previous article "One day countdown to approval of Bitcoin spot ETF application: The United States will not Let go easily! " said, "The new market is ready to develop, and the original market is more determined." This article combines OKLink, CryptoQuant and Glassnode three-party chain data to briefly analyze the BTC market from the perspective of BTC supply and demand and market distribution:
< strong>1. Analysis of BTC supply and demand status from on-chain data
From the supply side, as of the time of publication, according to CryptoQuant statistics, there are currently The BTC holdings of more than 30 centralized trading platforms are in an outflow state, with a total amount of approximately 71,934 BTC.
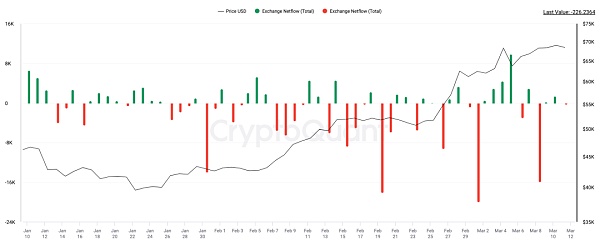
Chart: Net inflow/outflow of BTC from the centralized trading platform from January 11, 2024 to the present (complete data on March 10) (Unit: BTC)
Data source: CryptoQuant
In addition, we can also see that miners continue to sell, mainly due to liquidation before the next halving. The next mining halving will reduce the mining reward from 6.25 BTC to 3.125 BTC. As of the time of publication, the wallet bound to the cryptocurrency miner calculated that during the period since the adoption of the ETF, the net outflow of BTC from the address was approximately 8,530 BTC. In other words, the reduction of BTC from the two major supply sides of exchanges and miners is approximately 80,464 BTC. Here, we have used the number of net outflows for calculation, because the net outflow data includes the difference between the miners' own demand for currency hoarding and the actual mining of BTC.
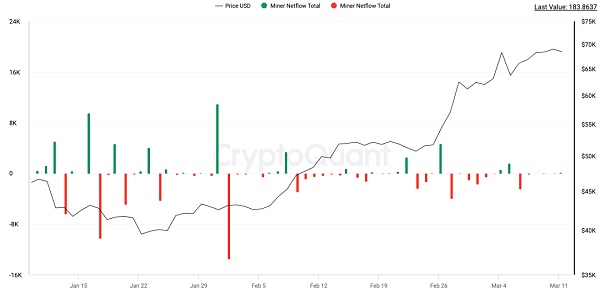
Chart: Net inflow/outflow of BTC from miner wallet addresses since January 11, 2024 (unit: BTC)
Data source: CryptoQuant
In On the demand side, although the market has been discussing Grayscale's continuous selling of BTC, due to statistical deviations from various data sources and deviations in the time when various institutions update spot ETFs, here is a comprehensive calculation based on CryptoQuant and Farside data, through BTC spot The cumulative amount of funds entering the market through ETF channels has reached US$9.594 billion. Compared with when BTC spot ETFs were allowed to trade, the total net inflow as of March 8, local closing time, was approximately 176,396 BTC. With the BTC spot ETF channel alone, BTC is in short supply in the market. The gap currently reaches more than 95,000 BTC. However, the real source of BTC supply is miners. Although there are BTC outflows through other channels such as exchanges, this is not a sustainable source of supply.
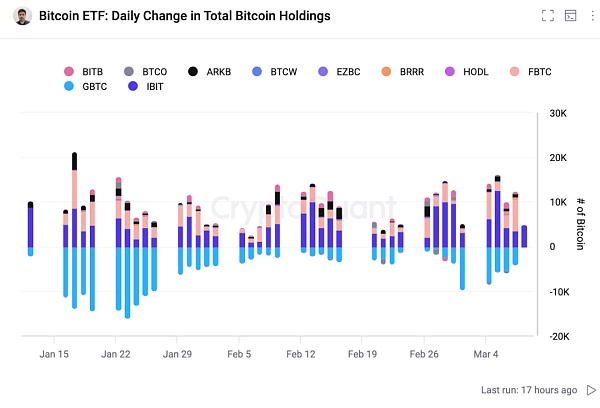
Chart: Net inflow/outflow of Bitcoin Spot ETF since January 11, 2024 (unit: BTC)
Data source: CryptoQuant
And in About 40 days later, the BTC halving will cut the newly generated supply in half. According to the setting of BTC: the reward will be halved every time 210,000 blocks are generated, until the block reward is 0 in 2140, all BTC will be issued, and the final total issuance will be constant at 21 million.
And it is different from previous halvings. A groundbreaking innovation has appeared in the BTC ecosystem - inscriptions. According to statistics on the Dune chain, currently The fees contributed to the BTC ecosystem from this innovation have reached 6,290 BTC, contributing part of the income to miners. In the future, with the development of innovative applications in the BTC ecosystem and the scalability of L2 solutions, miners' income will also increase, which will also slow down the actual pressure on miners to sell BTC for mining costs,which means that on the supply side The situation is different from the previous halvings. The pressure of selling on the market has decreased, and miners are more willing to hoard coins rather than "supply" them to the market.
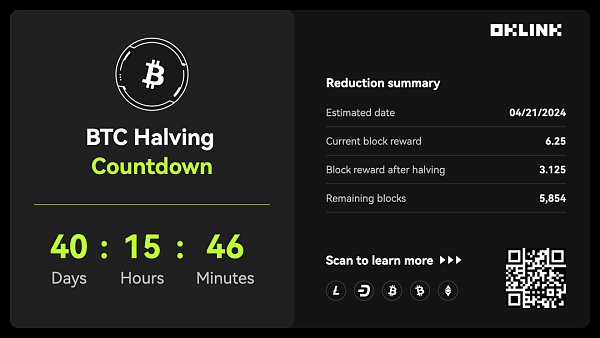
Figure BTC halving at 12 noon on March 11
Data source: OKLink
2. BTC market distribution: transferred to the chain
If we assume that most of the new investors are attracted by BTC spot ETFs Entering this market, the non-zero addresses on the chain can by default be dominated by old investors. According to OKLink data, the number of non-zero addresses on the chain shows a clear upward trend, which means that the number of addresses storing assets is increasing, not just new addresses to increase address interaction. It can also be seen from this There are signs of BTC transfers.
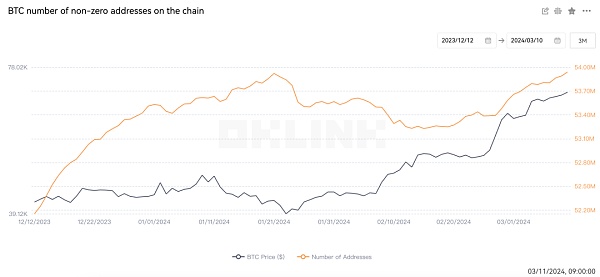
Chart of the number of BTC wallet addresses with non-zero assets in the past three months
Data source: OKLink
More detailed and specific asset movements are also available Go to the blockchain browser to view real-time dynamics and large transfers. It can be seen from OKLink data that the frequency of large-value BTC transfers has also increased in recent days.
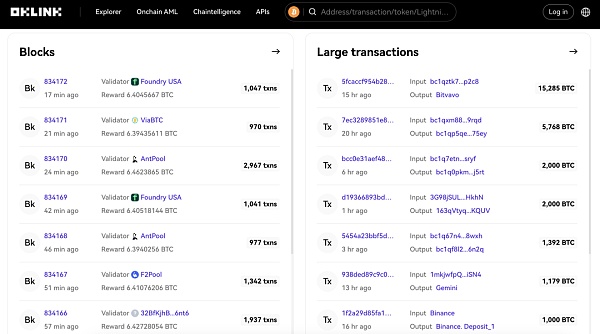
Figure BTC blockchain browser large asset transfer
Data source: OKLink
According to Glassnode statistics, the amount transferred to this long-term storage The number of BTC is increasing at a rate of 180,000 BTC per quarter, which is double the number of new BTC being mined. This shift toward BTC as a long-term investment further tightens the supply of BTC and may strengthen BTC’s price base as the halving approaches.
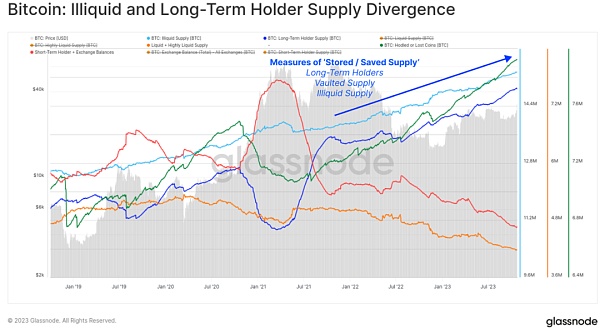
Figure illiquidity and supply divergence for long-term holders
Data source: Glassnode
Long-term holders go to the chain regardless of the slave address The numbers still show an expanding trend from both sides of the amount of funds. According to a recent report by Glassnode, the BTC lock-up rate for long-term investment has exceeded the new supply by more than 200%. This means that while new BTC is still being mined, more BTC is being held by investors rather than being sold or traded.
Three. VS gold ETF? Also look at scarcity
In addition to on-chain data showing that BTC is currently in a state of short supply, the scarcity of BTC also allows this trend to continue. Unlike fiat currency supply, which relies on central banks and the supply of precious metal assets including gold, which is naturally limited, the pace of BTC issuance and the total supply of 21 million has been dictated by its underlying protocol since its inception.
When it comes to scarcity, gold has to be mentioned. Gold, which is often compared to BTC, is also regarded as an asset that is in short supply due to its high mining costs and limited natural resources. Especially in response to situations such as inflation and war, its scarcity advantage becomes more prominent, and it is therefore known as a model of fear trading. Therefore, the historical performance of the gold market is often used to analyze the BTC market.
In terms of ETF performance, since the first gold spot ETF was approved in 2004, the price of gold has continued to rise, with an increase of 346% in less than 10 years. %. However, it took quite a while for gold to become widely recognized. In comparison, it only took 15 years from the birth of BTC to the adoption of spot ETF in 2024. While markets continue to heat up,what we need to consider is that gold has an important historical role in finance. In 1717, Britain adopted the gold standard for the first time, making gold an important part of the monetary system.
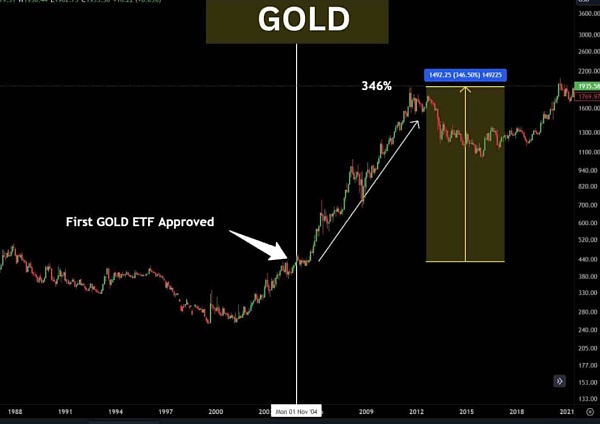
Comparison of gold before and after spot ETF
Data source: Ash Crypto
When discussing the uniqueness of BTC as "digital gold", in addition to its In addition to material scarcity, its uniqueness in the financial system also deserves attention. The decentralized design of BTC allows it to be held outside the traditional financial system, while also providing billions of people without bank accounts with the opportunity to enter the global financial system.
With the development of the BTC market, the decentralized nature of BTC has diversified participants and increasingly deepened its connection with traditional financial markets. There is a close relationship between market complexity and the acquisition of data. In this context, the analysis and acquisition of data on the chain are more convenient than data information in traditional financial markets. The data on the chain comes from node networks around the world and has the characteristics of a public ledger, allowing anyone to conduct market analysis and statistics in real time without relying on centralized institutions. This decentralized feature brings data transparency and fairness, and can effectively avoid the risk of single points of failure and tampering.
In the increasingly mature and complex encryption market, fortunately, the analysis and acquisition of on-chain data are easier than the data information of other financial markets. At your fingertips. The more complex the market, the more obvious the advantages of on-chain data will be. Due to its uniqueness, on-chain data will become our unique existence closest to the market truth.
 Xu Lin
 Xu Lin
 Huang Bo
 Edmund
 Edmund
 Bernice
 Bernice
 Xu Lin
 Bernice
 Cointelegraph
 Cointelegraph